
Anyone can be a Citizen Scientist by taking part in the next Bristol Avon RiverBlitz event. Go to our registration page to sign-up and take part in the next event.
Your data is used by BART to build a picture of what is happening at your local river where you take your measurement. Your results help to build a picture of what is affecting the ecosystem and identifies key areas which may be in need of restoration, or are clean and need protecting.
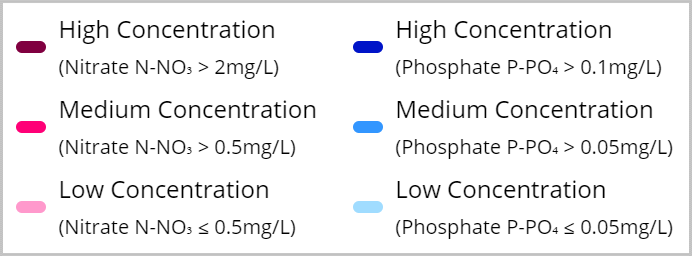
Nutrients, particularly phosphates and nitrates, are amongst the most common pollutants of freshwater across the world. As a result of their wide-ranging effects, levels of phosphate and nitrate are widely used as indicators of water quality. As shown on our RiverBlitz Explorer, we have provided a scale of high, medium and low concentrations of nitrate and phosphate.
High nutrient concentrations in rivers and streams can be detrimental, causing excessive growth of plants and harmful algal blooms. Algal blooms block sunlight from reaching other plants in the water. They also use up oxygen in the water at night which can suffocate fish and other creatures. Oxygen is also used up when the bloom decays.
As well as impacting wildlife, nutrient pollution can have economic impacts due to increasing water treatment costs, commercial and recreational fishing losses, and reduced tourism income.
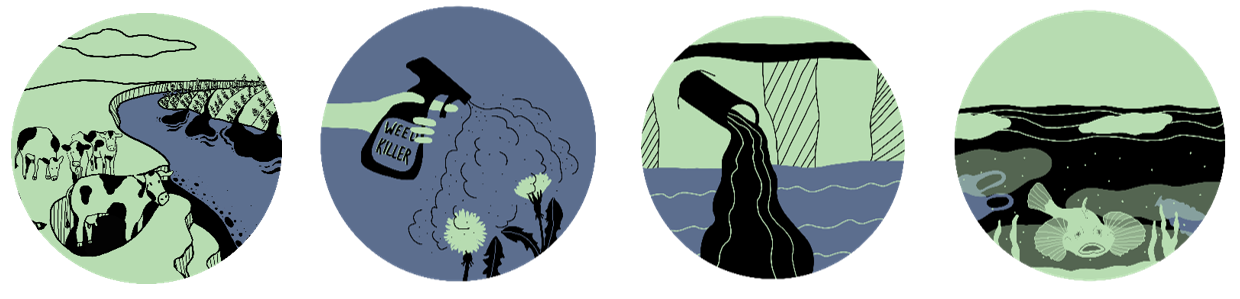
The most common causes of high nutrient concentrations include:
The additional factors you recorded during RiverBlitz can indicate a river's health and water quality, such as:
There are a range of other factors that can be measured to indicate water quality. In addition to nitrates and phosphates, dissolved oxygen, temperature, total dissolved solids, and turbidity can also be tested to give a more holistic indication of water quality.
You should take care before choosing to swim in rivers. While the levels of nitrates or phosphates are not a sufficient measure of whether a river is safe to swim in there may also be other pollutants or harmful bacteria that could cause harm to swimmers or pets. Our waterways suffer from the pressures of human populations and are receivers of Combined Sewer Overflow (CSO) discharges, storm drain outfalls and agricultural runoff so be wary when choosing to swim.
Remember that dogs can impact river health themselves, potentially disturbing wildlife and introducing harmful bacteria or chemicals to a sensitive ecosystem. Recent research has shown how pet flea treatments can harm river wildlife.
The Bristol Avon RiverBlitz captures water quality measurements at a particular moment in time. Measurements can be influenced by a range of factors including changes in weather, temperature, inputs from other connecting waters, the presence of animals or any number of other changeable factors can cause a different measurement to be found at a different time. Therefore, the data is used as an indicator of water quality to guide further investigations for more accurate and consistent measurements.
River health is measured using a combination of techniques and looks at a multitude of factors over a period of time. This is combined to give a health status of each river through the EU's Water Framework Directive.
By marking the sites where our Citizen Scientists took their measurements on the map, we can allocate them to their closest section of river. The measurements will apply 600 metres upstream of the closest part of the river, and 400 metres downstream. On the map, the segments of the river are coloured based on the nutrient levels recorded at that site. If there are multiple sites along a segment of river then the colouring is based on an average of those values.
The locations of the rivers on our map are based on the Ordinance Survey's Open Rivers dataset. This gives us an accurate picture of where the major rivers are in our catchment. However, the dataset does not include gated waterways (e.g. canals), lakes or some smaller streams.
These are measurement sites which have not been allocated to a section of river. However, you can still click on them to view their results. To avoid assigning measurement sites to the wrong river, we will only allocate a site if it is within 50 metres of a river. That does not mean that there is not a freshwater site at that location, just that it is not near a river in our dataset. We use all the measurements sites on the map to help us monitor our catchment whether they have been assigned to a river or not.
When two different water bodies meet it is difficult to know how this will affect the overall nutrient levels. Since we cannot say for sure what the likely levels will be, it is better not to show any data.
This interactive data viewer has been developed for us by Riskaware. If you would like to know more about what Riskaware do, and the products and services they offer please visit their website - www.riskaware.co.uk.
If you have any questions not covered by this FAQs page then please get in touch at info@bristolavonriverstrust.org