An amazing effort by 87 Citizen Scientists resulted in the 2022 Bristol Avon RiverBlitz being a huge success!
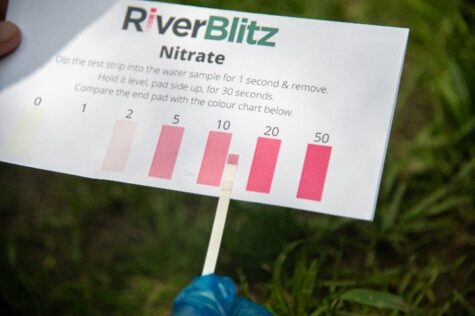
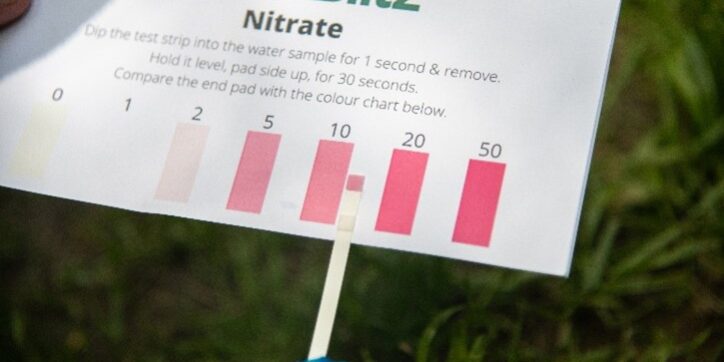
From the 11th to 18th July, volunteers took part in important water quality testing in their local streams and rivers throughout the Bristol Avon catchment. People of all ages were provided with our easy-to-use testing kits to measure concentrations of phosphates and nitrates, with a total of 143 samples collected and recorded across the catchment. This data is crucial and will provide us with a snapshot in time of nutrient levels throughout the catchment.
Many of this year’s participants attended local events that took place on the Cam and Wellow Brook, the Congresbury Yeo, the River Biss and the River Chew. At these events volunteers were supplied RiverBlitz testing kits and members of BART provided demonstrations before heading out to take their own samples. BART were thrilled to have such a fantastic turn out of keen and committed Citizen Scientists across multiple watercourses during these events.
Results
Analysis of all data collected in 2022, including the RiverBlitz data collected during the Land Yeo WaterBlitz during the Spring, shows that 70% of samples recorded a high level of nitrate (>2mg/L), with low levels of nitrate (<0.5mg/L) recorded in only 6% of samples. Levels greater than 0.5mg/L suggests water quality is likely to impact aquatic wildlife, particularly those sensitive to changes in water quality. Currently in England, there are no official standards for nitrate levels in freshwater bodies, but high levels of nitrate can cause significant impacts to aquatic ecosystems and are common in watercourses consisting of both urban and agricultural land use.
When compiling all of the RiverBlitz data collected this year, 70% of the samples recorded high phosphate levels (>0.1mg/L), with low levels of phosphate (<0.05mg/L) recorded in only 13% of samples.
The data collected during all of the Bristol Avon RiverBlitz events since 2016 can be found on our RiverBlitz explorer platform which provides tools for users to compare and explore the datasets. This is a great tool for checking out the data for your local watercourse and hope that the results collected by citizen scientists inspire you to take part in our RiverBlitz 2023 event!

What do the results mean?
Nutrients, particularly phosphates and nitrates, are amongst the most common pollutants of freshwater across the world. As a result of their wide-ranging effects, levels of phosphate and nitrate are widely used as indicators of water quality. High nutrient concentrations in rivers and streams can be detrimental, causing excessive growth of plants and harmful algal blooms. Algal blooms block sunlight from reaching other plants in the water. They also use up oxygen in the water at night which can suffocate fish and other creatures. Oxygen is also used up when the bloom decays.
As well as impacting wildlife, nutrient pollution can have economic impacts due to increasing water treatment costs, commercial and recreational fishing losses, and reduced tourism income.
The most common causes of high nutrient concentrations include:
- Pesticides and fertilisers are sources of nutrients that can contribute to pollution when they are washed into our rivers from agricultural land, sports grounds, market gardens and even our own back gardens.
- Agricultural pollution can be caused when livestock have free access to access watercourses or runoff from farm infrastructure or muck heaps flows directly into a watercourse.
- Water industry continuous discharges from water recycling centres. The single activity with the most widespread impact on rivers is discharges of treated sewage effluent.
- Combined Sewer Overflows (CSO’s) that are used to provide relief to the sewer system during heavy periods of rain, preventing our homes from flooding. However, when CSO’s kick in, rainwater mixed with raw sewage containing high concentrations of nitrates and phosphates is discharged into our rivers.
- Despite recent improvements in some of our urban rivers, towns and roads continue to have a negative impact on our rivers.

How reliable is the RiverBlitz as an indicator of river health?
The data collected during the Bristol Avon RiverBlitz captures water quality measurements at a particular moment in time. Your data is used by BART to build a picture of what is happening at your local river where you take your measurement. Your results help to build a picture of what is affecting the ecosystem and identifies key areas which may be in need of restoration or are clean and need protecting.
Measurements can be influenced by a range of factors including changes in weather, temperature, inputs from connecting watercourses, the presence of livestock or any number of other changeable factors can cause a different measurement to be found at a different time. Therefore, the data is helpful in providing an indicator for water quality which we share with our partners to guide further investigations for more accurate and consistent measurements.
River health is measured using a combination of techniques and looks at a multitude of factors over a period of time. This is combined to give a health status of each river through the EU’s Water Framework Directive.
Thank you!
Thank you to all of our amazing volunteers who once again turned up in force to do their bit for our local rivers.
We’d also like to say a big thank you to this year’s project funding partners: Defra’s Green Recovery Challenge Fund, Bath and North East Somerset, Wiltshire Wildlife Trust, Avon Wildlife Trust, Medlock Charitable Trust, Waitrose, and The Big Give.
RiverBlitz 2023
The team is already busy beginning to plan RiverBlitz 2023 to gather another year of valuable water quality data. To register your interest to volunteer for the 2023 project, or if you or your organisation is interested in supporting this project in the future, please email Rozy Gray: rozy@bristolavonriverstrust.org


